Investment Performance
Detailed performance results
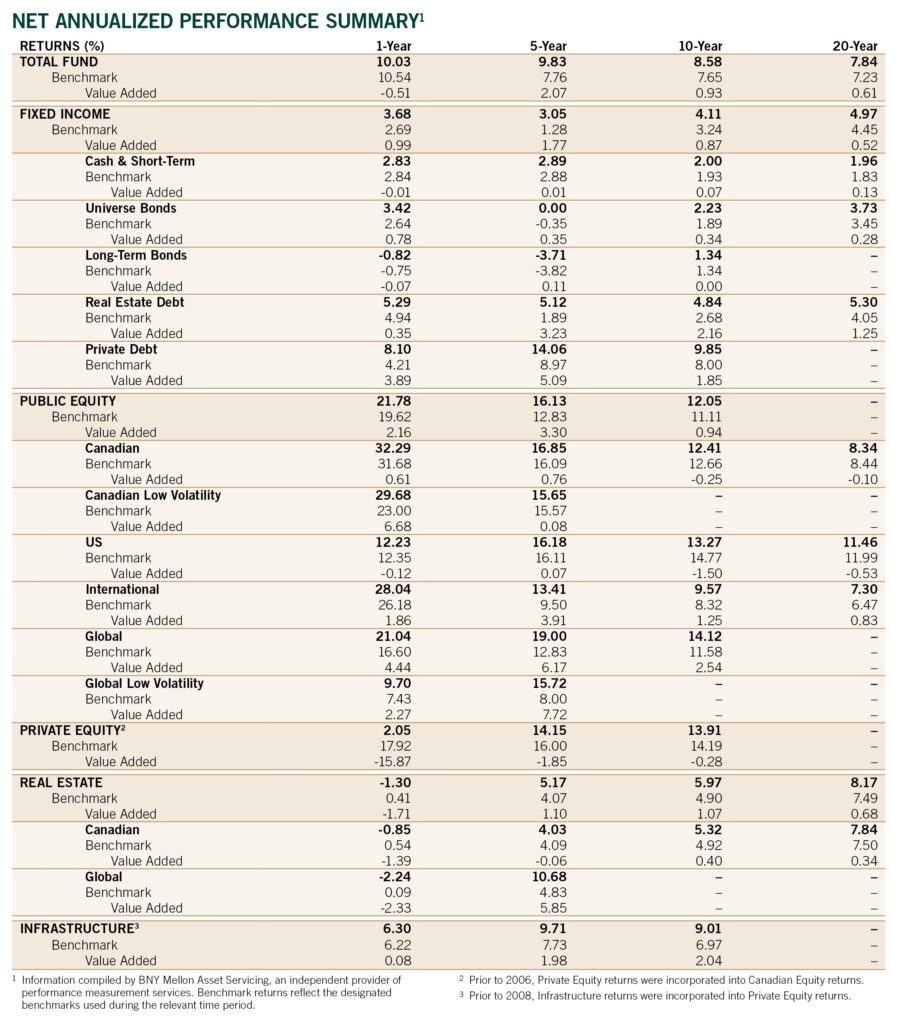
When assessing our results, the performance of each mandate is compared to the return of the benchmark that has been designated by the Investment Committee and approved by the Board.
This quantitative analysis, together with other qualitative criteria, assists in the review of each investment manager. We also measure our overall portfolio performance against a weighted average of the benchmark returns based on our target allocations.
The table below shows the returns, net of expenses, for the total portfolio and each asset class (as well as the corresponding benchmark return used during the corresponding time period) for the one-year, five-year, 10-year and 20-year periods ended December 31, 2025. All investment-related expenses, including investment manager fees directly attributable to each asset class, as well as a proportional allocation of staff salaries, benefits and other investment-related expenses, have been accounted for in determining the net returns presented below.